Provide an appropriate response.
-The following graph represents a function. Describe the function in words. 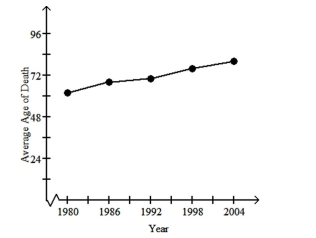
A) The function shows a steadily increasing average age of death between 1980 and 2004.
B) The function shows a steadily decreasing average age of death between 1980 and 2004.
C) The function shows that the average age of death increases between 1980 and 1992 and does not change between 1992 and 2004.
D) The function shows that the average age of death per year does not change between 1980 and 2004.
Correct Answer:
Verified
Q53: After 60 years, a population growing at
Q54: Provide an appropriate response.
-Cars sold 
Q55: The population of a town with
Q56: Write an equation for the linear
Q57: Provide an appropriate response.
-The population of
Q59: Write an equation for the linear
Q60: Create the required linear function an
Q61: Provide an appropriate response.
-The population of a
Q62: A linear function has a varying rate
Q63: Find the slope of the graph
Unlock this Answer For Free Now!
View this answer and more for free by performing one of the following actions

Scan the QR code to install the App and get 2 free unlocks

Unlock quizzes for free by uploading documents