The stack plot below shows the value of each of Danny's investments. The stack plot contains three regions. Theuppermost unshaded region represents the value of Danny's investment in individual stocks. The center shaded regionrepresents the value of Danny's investment in mutual funds and the bottom region in black represents the value ofDanny's investment in a CD. The thickness of a region at a particular time tells you its value at that time. 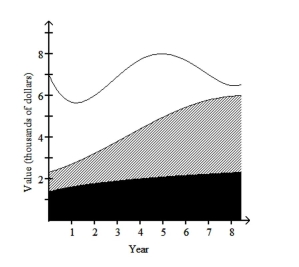 Use the graph to answer the question.
-In which year was the value of Danny's investment in individual stocks the least?
A) year 1
B) year 8
C) year 7
D) year 0
Correct Answer:
Verified
Q173: Use the graph to answer the question.
-
Q174: State whether you think that the variables
Q175: State whether the scatter diagram shows strong
Q176: Answer the question.
-What name is given to
Q177: Use the guidelines to evaluate the study.
Q179: Identify which of these types of sampling
Q180: Construct a pie chart representing the
Q181: Use the guidelines to evaluate the study.
Q182: State whether you think that the variables
Q183: Identify the variable as either qualitative or
Unlock this Answer For Free Now!
View this answer and more for free by performing one of the following actions

Scan the QR code to install the App and get 2 free unlocks

Unlock quizzes for free by uploading documents