The following contingency table provides a joint frequency distribution for the popular votes cast in the 1984 presidential election by region and political party. Data are in thousands, rounded to the nearest thousand. 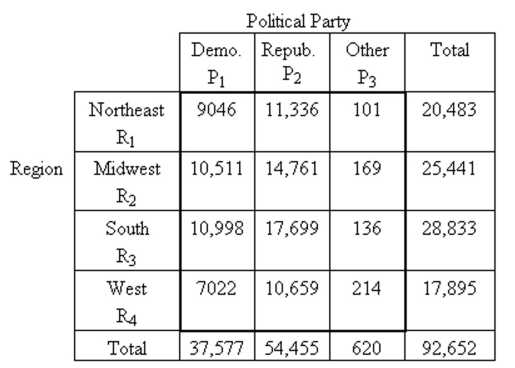 If a person who voted in the 1984 presidential election is selected at random, . Interpret this probability in terms of percentages.
Correct Answer:
Verified
View Answer
Unlock this answer now
Get Access to more Verified Answers free of charge
Q7: Interpret the symbol
Q8: Consider the following counting problem. Allison is
Q9: Consider the following counting problem. A pool
Q10: Give an example of a collection of
Q13: A card is selected randomly from a
Q14: Provide an appropriate response.
-Discuss the range of
Q14: On an exam question asking for
Q15: Consider the following counting problem. How many
Q16: An experiment consists of randomly selecting a
Q17: Provide an appropriate response.
-Define mutually exclusive events
Unlock this Answer For Free Now!
View this answer and more for free by performing one of the following actions

Scan the QR code to install the App and get 2 free unlocks

Unlock quizzes for free by uploading documents