A graphical display of a data set is given. Identify the overall shape of the distribution as (roughly) bell-shaped,triangular, uniform, reverse J-shaped, J-shaped, right skewed, left skewed, bimodal, or multimodal.
-The ages of a group of patients being treated at one hospital for osteoporosis are summarized in the frequency histogram below. 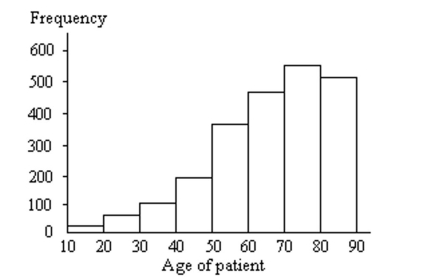
A) Right skewed
B) Reverse J-shaped
C) Left skewed
D) Bell-shaped
Correct Answer:
Verified
Q63: Complete the contingency table and use
Q64: Construct a pie chart representing the
Q65: Construct a dotplot for the given
Q66: The set of possible values that a
Q67: Construct a dotplot for the given
Q69: A graphical display of a data
Q70: Construct a stem-and-leaf diagram for the
Q71: A nurse measured the blood pressure of
Q72: Use single-value grouping to organize these
Q73: Provide the requested response.
-The table contains
Unlock this Answer For Free Now!
View this answer and more for free by performing one of the following actions

Scan the QR code to install the App and get 2 free unlocks

Unlock quizzes for free by uploading documents