SCENARIO 19-3 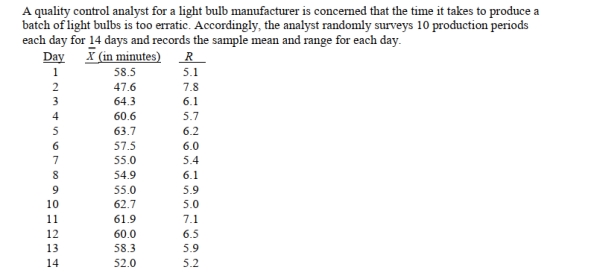
-Referring to Scenario 19-3, suppose the analyst constructs an R chart to see if the variability in
Production times is in-control.What is the center line of this R chart?
A) 4.8
B) 6.0
C) 6.9
D) 7.1
Correct Answer:
Verified
Q3: SCENARIO 19-2
A political pollster randomly selects a
Q6: The control chart
A)focuses on the time dimension
Q8: SCENARIO 19-1
A local newspaper has 10 delivery
Q9: SCENARIO 19-1
A local newspaper has 10 delivery
Q11: SCENARIO 19-1
A local newspaper has 10 delivery
Q13: Which of the following situations suggests a
Q15: SCENARIO 19-2
A political pollster randomly selects a
Q17: A process is said to be out
Q18: Which of the following situations suggests a
Q19: The principal focus of the control chart
Unlock this Answer For Free Now!
View this answer and more for free by performing one of the following actions

Scan the QR code to install the App and get 2 free unlocks

Unlock quizzes for free by uploading documents