SCENARIO 2-4
A survey was conducted to determine how people rated the quality of programming available on
television.Respondents were asked to rate the overall quality from 0 (no quality at all) to 100
(extremely good quality) .The stem-and-leaf display of the data is shown below. 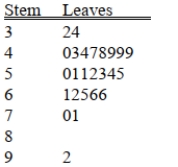
-Referring to Scenario 2-4, what percentage of the respondents rated overall television quality
With a rating from 50 through 75?
A) 11
B) 40
C) 44
D) 56
Correct Answer:
Verified
Q4: SCENARIO 2-2
2-2 Organizing and Visualizing Variables
At a
Q11: When constructing charts,the following is plotted at
Q11: SCENARIO 2-4
A survey was conducted to determine
Q12: SCENARIO 2-2
At a meeting of information systems
Q14: SCENARIO 2-3
Every spring semester, the School of
Q15: SCENARIO 2-5
The following are the duration in
Q18: SCENARIO 2-5
The following are the duration in
Q19: A type of vertical bar chart in
Q19: SCENARIO 2-5
The following are the duration in
Q21: Data on the number of credit hours
Unlock this Answer For Free Now!
View this answer and more for free by performing one of the following actions

Scan the QR code to install the App and get 2 free unlocks

Unlock quizzes for free by uploading documents