A dot plot of the speeds of a sample of 50 cars passing a policeman with a radar gun is shown below. 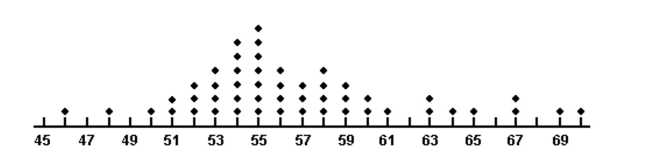 What proportion of the motorists were driving above the posted speed limit of 55 miles per hour?
A) 0.14
B) 7
C) 0.50
D) 0.64
Correct Answer:
Verified
Q16: The table shows the number of each
Q17: One of the questions posed to a
Q18: What class percentage corresponds to a class
Q19: What number is missing from the
Q20: If 25% of your statistics class is
Q22: Parking at a university has become a
Q23: The scores for a statistics test
Q24: 252 randomly sampled college students were asked,
Q25: A sociologist recently conducted a survey
Q26: The bars in a histogram should be
Unlock this Answer For Free Now!
View this answer and more for free by performing one of the following actions

Scan the QR code to install the App and get 2 free unlocks

Unlock quizzes for free by uploading documents