A fast food chain test marketing a new sandwich chose 18 of its stores in one major
metropolitan area. Nine of the stores were in malls and nine were free standing. The
sandwich was offered at three different introductory prices. The table shows the number
of new sandwiches sold at each location for each location type and price combination. Number of New Sandwiches Sold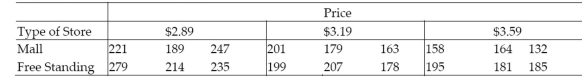
a. Write a model for the mean number of sandwiches sold, , assuming that the relationship between and price, , is first-order.
b. Fit the model to the data.
c. Write the prediction equations for mall and free-standing stores.
d. Do the data provide sufficient evidence that the change in number of sandwiches sold with respect to price is different for mall and free-standing stores? Use .
Correct Answer:
Verified
View Answer
Unlock this answer now
Get Access to more Verified Answers free of charge
Q78: When using the model
Q79: Consider the second-order model
Q80: A collector of grandfather clocks believes
Q81: A nested model F-test can only be
Q82: One advantage to writing a single
Q84: It is desired to build a
Q85: In situations where two competing models have
Q86: Operations managers often use work sampling
Q87: Consider the model
Q88: The model
Unlock this Answer For Free Now!
View this answer and more for free by performing one of the following actions

Scan the QR code to install the App and get 2 free unlocks

Unlock quizzes for free by uploading documents