In a comprehensive road test for new car models, one variable measured is the time it
takes the car to accelerate from 0 to 60 miles per hour. To model acceleration time, a
regression analysis is conducted on a random sample of 129 new cars. TIME60: = Elapsed time (in seconds) from to
MAX: Maximum speed attained (miles per hour)
The simple linear model was fit to the data. Computer printouts for the analysis are given below:
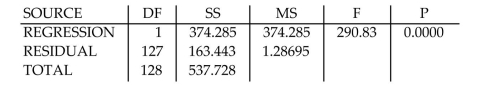
CASES INCLUDED 129 MISSING CASES 0
Correct Answer:
Verified
View Answer
Unlock this answer now
Get Access to more Verified Answers free of charge
Q1: The equation for a (deterministic) straight
Q2: Consider the data set shown below.
Q3: Plot the line y = 4 -
Q5: The probabilistic model allows the E(y)values to

Unlock this Answer For Free Now!
View this answer and more for free by performing one of the following actions

Scan the QR code to install the App and get 2 free unlocks

Unlock quizzes for free by uploading documents