The line graph shows the recorded hourly temperatures in degrees Fahrenheit at an airport. Use the graph to answer the
question. 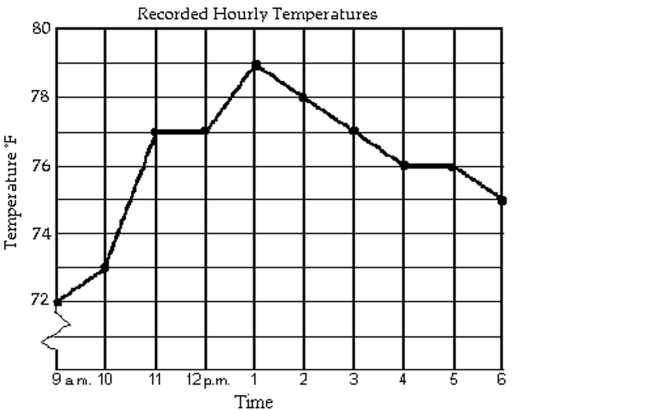
-What temperature was recorded at 10 a.m.?
A)
B)
C)
D)
Correct Answer:
Verified
Q5: The bar graph shows the number
Q6: The line graph shows the recorded
Q7: Plot the ordered pair. State in
Q8: Plot the ordered pair. State in
Q9: Plot the ordered pair. State in
Q11: The bar graph shows the number
Q12: The line graph shows the recorded hourly
Q13: The bar graph shows the number
Q14: Plot the ordered pair. State in
Q15: The bar graph shows the number
Unlock this Answer For Free Now!
View this answer and more for free by performing one of the following actions

Scan the QR code to install the App and get 2 free unlocks

Unlock quizzes for free by uploading documents