Solve the problem.
-The value of a particular car is represented in the following graph. Find the rate of change of the value of the car with respect to time, in dollars per year. 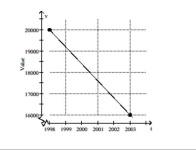
A) -$600 per year
B) -$700 per year
C) -$850 per year
D) -$800 per year
Correct Answer:
Verified
Q100: Find the slope of the line.
-
Q101: Find the slope of the line.
-y =
Q102: Find the slope of the line going
Q103: Find the slope of the line.
-2x
Q104: Solve the problem.
-The following graph shows data
Q106: Solve the problem.
-An old house has a
Q107: Find the slope of the line going
Q108: Find the slope of the line.
-
Q109: Solve the problem.
-Over one particular stretch of
Q110: Provide an appropriate response.
-The ordered pair (0,
Unlock this Answer For Free Now!
View this answer and more for free by performing one of the following actions

Scan the QR code to install the App and get 2 free unlocks

Unlock quizzes for free by uploading documents