The figure represents the average credit card debt for selected households in Silerville. 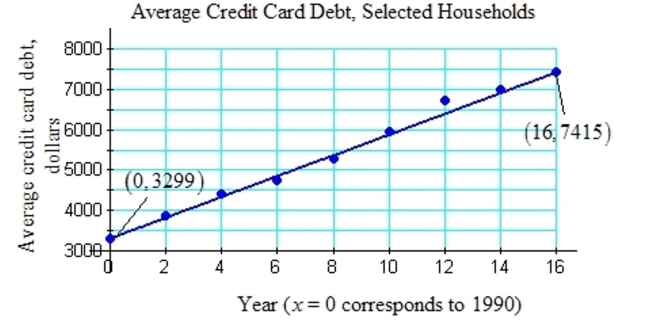 Let y represent the credit card debt in dollars. Let x represent the year, where x = 0 corresponds to the year 1990, x = 4 represents 1994, and so on.
a. Use the ordered pairs given in the graph, (0, 3299) and (16, 7415) to find a linear equation to estimate the average credit card debt versus the year. Round the slope to the nearest tenth.
b. Use the model from (a) to estimate the average debt in 2003. Round to the nearest dollar.
c. Interpret the slope of the model in the context of this problem.
Correct Answer:
Verified
b. $6644 ...
View Answer
Unlock this answer now
Get Access to more Verified Answers free of charge
Q57: Determine if the lines are parallel,
Q58: Determine if the lines are parallel,
Q59: Determine if the lines are parallel,
Q60: Determine if the lines are parallel,
Q61: Write an equation of the line satisfying
Q63: A tool rental store charges a flat
Q64: Write an equation of the line
Q65: The S-Cargo shipping company calculates shipping
Q66: The following figure represents the average
Q67: Write an equation of the line satisfying
Unlock this Answer For Free Now!
View this answer and more for free by performing one of the following actions

Scan the QR code to install the App and get 2 free unlocks

Unlock quizzes for free by uploading documents