Multiple Choice
Thirty households were surveyed for the number of televisions in each home. Following a results.
Construct a frequency histogram.
A) 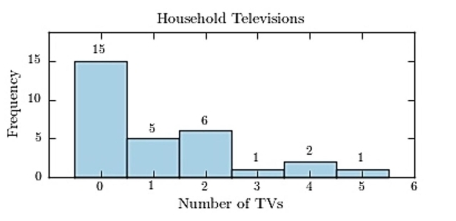
B) 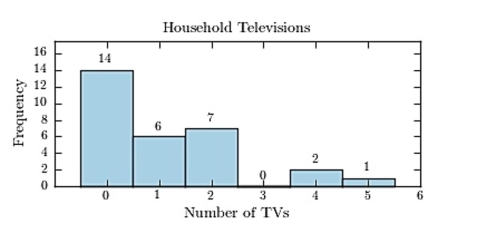
C) 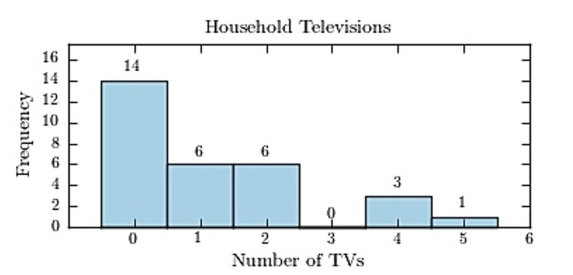
D) 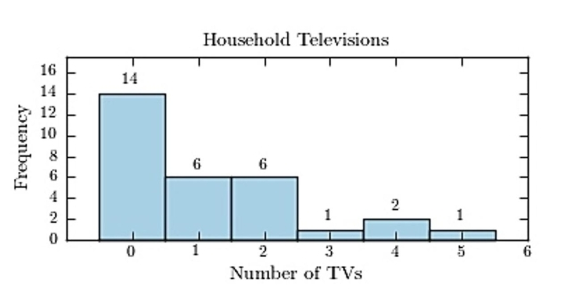
Correct Answer:
Verified
Related Questions
Q63: The following frequency distribution presents the
Q64: Karen is constructing a pie graph
Q65: Thirty households were surveyed for the
Q66: The following pie chart presents the percentages
Q67: A sample of 200 high school
Q69: 
Unlock this Answer For Free Now!
View this answer and more for free by performing one of the following actions

Scan the QR code to install the App and get 2 free unlocks

Unlock quizzes for free by uploading documents