The following table gives the US domestic oil production rates (excluding Alaska) over the past few years. A regression equation was fit to the data and the residual plot is shown below. 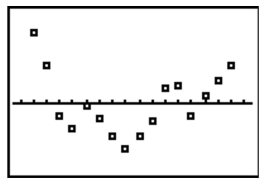
Does the residual plot suggest that the regression equation is a bad model? Why or why
not?
Correct Answer:
Verified
View Answer
Unlock this answer now
Get Access to more Verified Answers free of charge
Q8: What is the relationship between the linear
Q39: Discuss the guidelines under which the linear
Q40: Applicants for a particular job, which
Q41: Is the data point, P, an outlier,
Q42: Is the data point, P, an
Q44: When performing a rank correlation test,
Q45: Use the rank correlation coefficient to
Q46: The following scatterplot shows the percentage
Q47: Is the data point, P, an outlier,
Q48: The following scatterplot shows the percentage
Unlock this Answer For Free Now!
View this answer and more for free by performing one of the following actions

Scan the QR code to install the App and get 2 free unlocks

Unlock quizzes for free by uploading documents