Here are data about the average January low temperature in cities in the United States, and factors that might allow us to
predict temperature. The data, available for 55 cities, include:  We will attempt to make a regression model to help account for mean January temperature and to understand the effects of
the various predictors.
At each step of the analysis you may assume that things learned earlier in the process are known.
Units Note: The "degrees" of temperature, given here on the Fahrenheit scale, have only coincidental language relationship to
the "degrees" of longitude and latitude. The geographic "degrees" are based on modeling the Earth as a sphere and dividing it
up into 360 degrees for a full circle. Thus 180 degrees of longitude is halfway around the world from Greenwich, England
(0°) and Latitude increases from 0 degrees at the Equator to 90 degrees of (North) latitude at the North Pole. 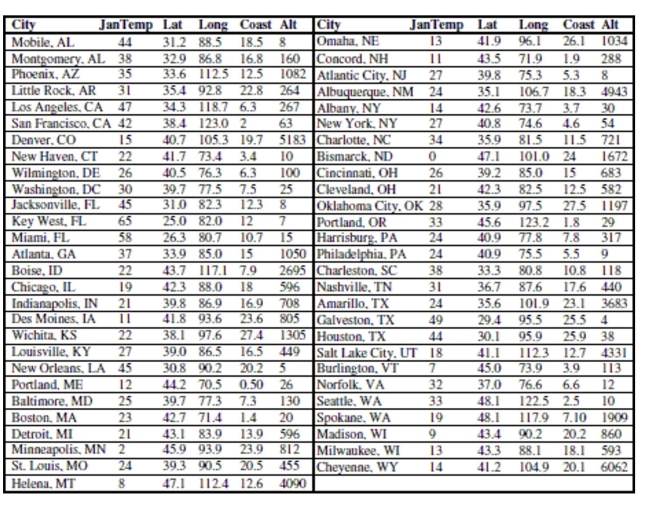
-First, we consider the relationship between temperature and latitude. This seems to be the
obvious first choice; everybody knows that northern (high latitude) cities tend to be colder
in January than southern (lower latitude) cities. Here is the scatterplot: 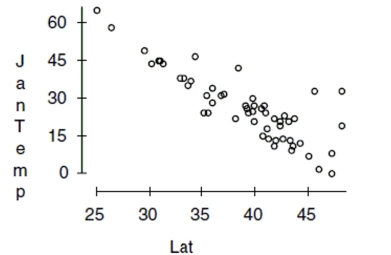
Describe what you see in this scatterplot in a sentence or two. Which of the regression
assumptions for the regression of Jantemp on Lat can you check with this plot? State them
and indicate whether you think they seem to be satisfied.
Correct Answer:
Verified
View Answer
Unlock this answer now
Get Access to more Verified Answers free of charge
Q12: Here are data about the average
Q13: Here are data about the average January
Q14: When a sum of squares is divided
Q15: For a class project, students tested
Q18: Of the 23 first year male
Q18: The regression below predicts the daily
Q19: The regression below predicts the daily
Q20: The regression below predicts the daily
Q21: A student wants to build a
Q22: Here are data about the average
Unlock this Answer For Free Now!
View this answer and more for free by performing one of the following actions

Scan the QR code to install the App and get 2 free unlocks

Unlock quizzes for free by uploading documents