Students A growing school district tracks the student population growth over the years
from 2008 to 2013. Here are the regression results and a residual plot. students year
Sample size: 6
students y
Sample size: 6
R-sq 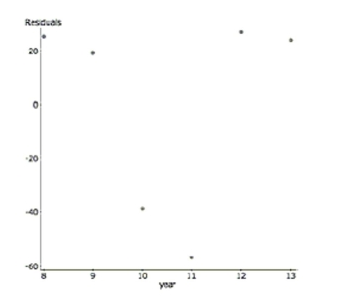
a. Explain why despite a high R-sq, this regression is not a successful model.
To linearize the data, the log (base 10) was taken of the student population. Here are the results.
Dependent Variable: log(students) Sample size: 6
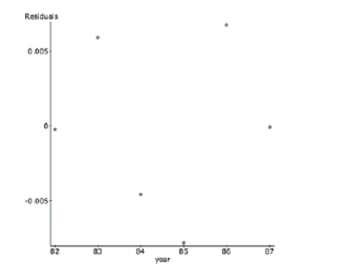
b. Describe the success of the linearization.
c. Interpret R-sq in the context of this problem.
d. Predict the student population in 2014.
Correct Answer:
Verified
View Answer
Unlock this answer now
Get Access to more Verified Answers free of charge
Q2: Create a model to predict postal rates
Q75: Music and grades (True Story) A couple
Q127: Storks Data show that there is a
Q128: A common objective for many school
Q129: Breaking strength A company manufactures polypropylene
Q130: The following is a scatterplot of
Q132: Halloween is a fun night. It
Q133: Maple trees A forester would like
Q135: During a science lab, students heated
Q136: Associations For each pair of variables,
Unlock this Answer For Free Now!
View this answer and more for free by performing one of the following actions

Scan the QR code to install the App and get 2 free unlocks

Unlock quizzes for free by uploading documents