The bigger the stop sign, the more expensive it is. Here is a graph of the height of a sign in inches versus its cost in dollars.
To achieve linearity, the data was transformed using a square root function of cost. Here are the results and a residual plot.
Dependent Variable: sqrt(cost)
(correlation coefficient)
s: 0.2141
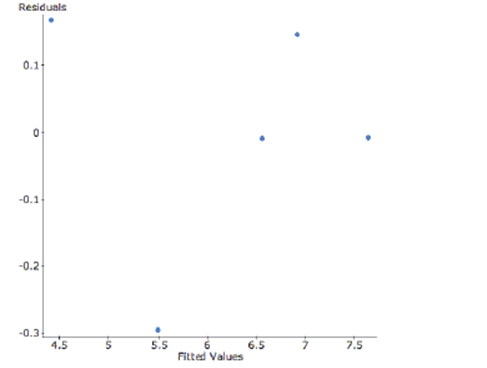
-Do you think this transformation for linearity was successful? Why?
Correct Answer:
Verified
View Answer
Unlock this answer now
Get Access to more Verified Answers free of charge
Q120: The bigger the stop sign, the
Q121: A study examined the number of
Q122: Which statement about re-expressing data is not
Q123: An article in the Journal of
Q124: Which statement about correlation is true?
I.
Q126: One of your classmates is working on
Q127: During a chemistry lab, students were
Q128: doing homework found
Q129: The correlation between a family's weekly income
Q130: Although there are annual ups and downs,
Unlock this Answer For Free Now!
View this answer and more for free by performing one of the following actions

Scan the QR code to install the App and get 2 free unlocks

Unlock quizzes for free by uploading documents