The standard deviation of the data displayed in this dotplot is closest to… 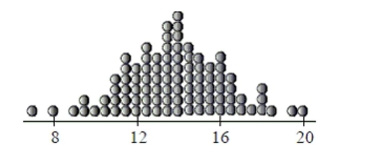
A) 2.
B) 4.
C) 1.
D) 3.5.
E) 0.5.
Correct Answer:
Verified
Q14: Environmental researchers have collected rain acidity data
Q15: A professor has kept records on grades
Q16: Which type of plot would be most
Q17: Which type of plot would be least
Q18: Which of these variables is most likely
Q20: Which of the following summaries are changed
Q21: The SPCA has kept these data records
Q22: Which is true of the data whose
Q23: The SPCA collects the following data about
Q24: Which is true of the data shown
Unlock this Answer For Free Now!
View this answer and more for free by performing one of the following actions

Scan the QR code to install the App and get 2 free unlocks

Unlock quizzes for free by uploading documents