A common objective for many school administrators is to increase the number of students
taking SAT and ACT tests from their school. The data from each state from 2003 are
reflected in the scatterplot. 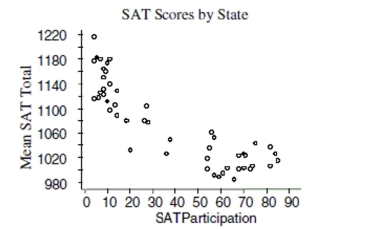
a. Write a few sentences describing the association.
b. Estimate the correlation. ________
c. If the point in the top left corner (4, 1215) were removed, would the correlation become
stronger, weaker, or remain about the same? Explain briefly.
d. If the point in the very middle (38, 1049) were removed, would the correlation become
stronger, weaker, or remain about the same? Explain briefly.
Correct Answer:
Verified
Q1: On the axes below, sketch a scatterplot
Q3: A consumer group collected information on HDTVs
Q4: Identify what is wrong with each
Q6: The following scatterplot shows the relationship
Q7: The auto insurance industry crashed some test
Q8: Match each graph with the appropriate
Q11: The following scatterplot shows a relationship
Q85: One of your classmates is reading through
Q98: After conducting a survey at a pet
Q102: Match the following descriptions with the most
Unlock this Answer For Free Now!
View this answer and more for free by performing one of the following actions

Scan the QR code to install the App and get 2 free unlocks

Unlock quizzes for free by uploading documents