Penicillin Doctors studying how the human body assimilates medication inject some
patients with penicillin, and then monitor the concentration of the drug (in units/cc) in the
patients' blood for seven hours. The data are shown in the scatterplot. First they tried to fit
a linear model. The regression analysis and residuals plot are shown. Dependent variable is:
Concentration
No Selector
R squared R squared (adjusted)
with degrees of freedom
a. Find the correlation between time and concentration.
b. Using this model, estimate what the concentration of penicillin will be after 4 hours.
c. Is that estimate likely to be accurate, too low, or too high? Explain.
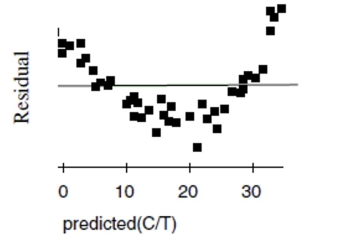
Now the researchers try a new model, using the re-expression log(Concentration). Examine
the regression analysis and the residuals plot below. Dependent variable is: LogCnn No Selector R squared R squared (adjusted)
with degrees of freedom
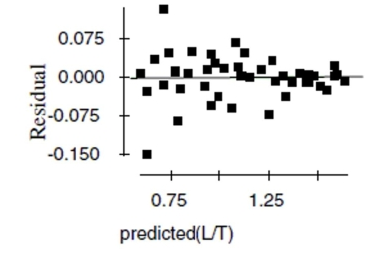
d. Explain why you think this model is better than the original linear model.
e. Using this new model, estimate the concentration of penicillin after 4 hours.
Correct Answer:
Verified
b.
c. Too high; ...
View Answer
Unlock this answer now
Get Access to more Verified Answers free of charge
Q61: Math and Verbal Suppose the correlation between
Q98: Height and weight Suppose that both height
Q127: Storks Data show that there is a
Q129: A residuals plot is useful because
I. it
Q130: Although there are annual ups and downs,
Q131: Which statement about correlation is true?
I.
Q132: All but one of the statements below
Q133: Which of the following is not a
Q137: A correlation of zero between two quantitative
Q139: Personal debt According to The World
Unlock this Answer For Free Now!
View this answer and more for free by performing one of the following actions

Scan the QR code to install the App and get 2 free unlocks

Unlock quizzes for free by uploading documents