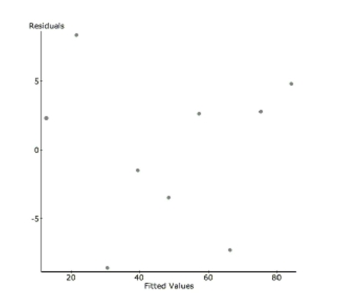
Shrimp From 1982 to 1990, there was a decrease in the number of white shrimp harvested
from the Galveston Bay. Here is the regression analysis and a residual plot. The year has
been shortened to two digits (82, 83…) and the dependent variable is the number of shrimp
collected per hour. Dependent Variable: Shrimp/hour
a. Write the regression equation and define your variables.
b. Find the correlation coefficient and interpret it in context.
c. Interpret the value of the slope in context.
d. In 1991, the shrimp production rebounded (in part due to the effects of El Nino) to 81
shrimp/hour. Find the value of this residual.
e. The prediction for 1991 was very inaccurate. What name do statisticians give to this kind
of prediction error?
Correct Answer:
Verified
b.
View Answer
Unlock this answer now
Get Access to more Verified Answers free of charge
Q4: Check the conditions for the regression and
Q18: Of the 23 first year male
Q20: The regression below predicts the daily
Q25: The regression below predicts the daily
Q32: Of the 23 first year male
Q164: Here is a partial regression plot for
Q166: For a class project, students tested
Q167: It is possible that the distance
Q170: If the diameter is increased from 4
Q171: Here is the corresponding regression table:
Unlock this Answer For Free Now!
View this answer and more for free by performing one of the following actions

Scan the QR code to install the App and get 2 free unlocks

Unlock quizzes for free by uploading documents