Students A growing school district tracks the student population growth over the years
from 2008 to 2013. Here are the regression results and a residual plot. students year
Sample size: 6
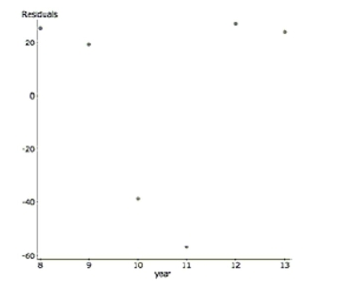
a. Explain why despite a high , this regression is not a successful model.
To linearize the data, the (base 10 ) was taken of the student population. Here are the results.
Dependent Variable: (students)
Sample size: 6
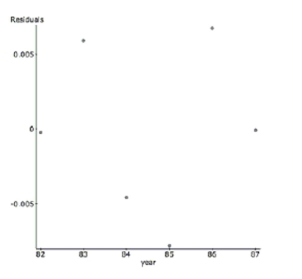
b. Describe the success of the linearization.
c. Interpret R-sq in the context of this problem.
d. Predict the student population in 2014.
Correct Answer:
Verified
View Answer
Unlock this answer now
Get Access to more Verified Answers free of charge
Q4: Check the conditions for the regression and
Q18: The regression below predicts the daily
Q19: The regression below predicts the daily
Q25: The regression below predicts the daily
Q71: In 2010, the United Nations claimed that
Q86: Before you took this course, you
Q175: A student wants to build a
Q177: Here are data about the average January
Q180: Now, consider longitude. Should the longitude
Q181: The problem of collinearity occurs when
A) there
Unlock this Answer For Free Now!
View this answer and more for free by performing one of the following actions

Scan the QR code to install the App and get 2 free unlocks

Unlock quizzes for free by uploading documents