Poverty In a study of how the burden of poverty varies among U. S. regions, a random
sample of 1000 individuals from each region of the United States recently yielded the
information on poverty (based on defining the poverty level as an income below $10,400
for a family of 4 people). The data and calculation of the test statistic is shown in the table
below. (All the conditions are satisfied - don'ft worry about checking them.) 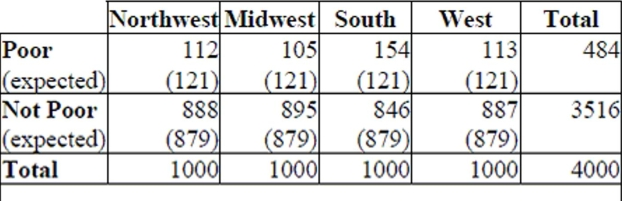
a. Write appropriate hypotheses.
b. Suppose the expected values had not been given. Show exactly how to calculate the
expected count in the first cell.
c. How many degrees of freedom are there?
d. State your complete conclusion in context.
Correct Answer:
Verified
View Answer
Unlock this answer now
Get Access to more Verified Answers free of charge
Q6: Peanut M&Ms According to the Mars Candy
Q52: A state's Department of Education reports that
Q68: Housing costs A government report on housing
Q271: AP Grading Every year Educational Testing
Q273: Packing Line A packing company investigates hiring
Q274: Doctors at a technology research facility
Q275: Which of the following equations used
Q278: Blood pressure Researchers developing new drugs
Q279: A marketing company reviewing the length of
Q280: A random sample of 120 classrooms at
Unlock this Answer For Free Now!
View this answer and more for free by performing one of the following actions

Scan the QR code to install the App and get 2 free unlocks

Unlock quizzes for free by uploading documents