For the following table of data,
A. Draw a scatterplot.
B. Calculate the correlation coefficient.
C. Calculate the least squares line and graph it on the scatterplot.
D. Predict the y-value when x is -19. 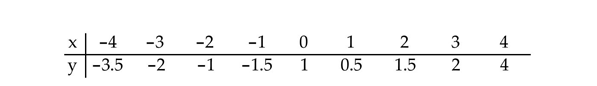
A) 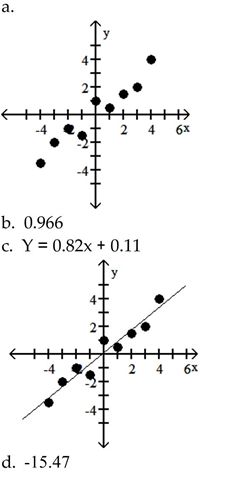
B) 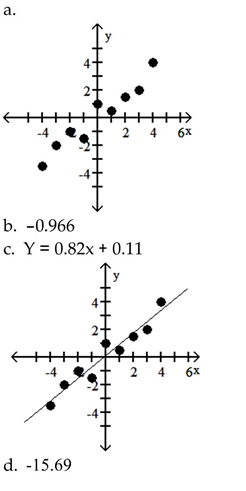
C) 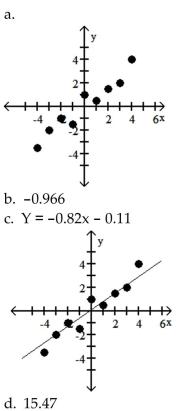
D) 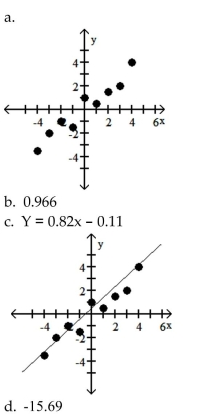
Correct Answer:
Verified
Q57: Find an equation in slope-intercept form
Q58: Solve the problem.
-A car rental company charges
Q59: Solve the problem.
-For the following table of
Q60: Solve the problem.
-The paired data below consist
Q61: Solve the problem.
-Northwest Molded molds plastic handles
Q63: Suppose that the demand and price
Q64: Evaluate the function as indicated.
-Find
Q65: Suppose that the population of a certain
Q66: Find an equation in slope-intercept form
Q67: Find the slope of the line
Unlock this Answer For Free Now!
View this answer and more for free by performing one of the following actions

Scan the QR code to install the App and get 2 free unlocks

Unlock quizzes for free by uploading documents