Draw and Interpret Boxplots
-SAS was used to compare the high school dropout rates for the 50 states in 1982 and 1984. The box plots generated for these dropout rates are shown below. Compare the center of the distributions and the variation of the distributions for the two years. 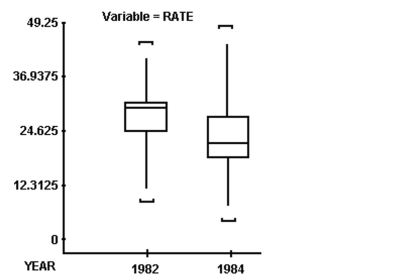
A) Dropout rates had a higher average with less variability in 1982 than in 1984.
B) Dropout rates had a higher average with more variability in 1982 than in 1984.
C) Dropout rates had a lower average with more variability in 1982 than in 1984.
D) Dropout rates had a lower average with less variability in 1982 than in 1984.
Correct Answer:
Verified
Q147: Draw and Interpret Boxplots
-A survey of 200
Q148: Draw and Interpret Boxplots
-The cholesterol levels
Q149: Provide an appropriate response.
-Given the following
Q150: Draw and Interpret Boxplots
-The test scores
Q151: Provide an appropriate response.
-A group of
Q153: Provide an appropriate response.
-Eleven high school
Q154: Provide an appropriate response.
-Given the following
Q155: Provide an appropriate response.
-The selling prices
Q156: Provide an appropriate response.
-A random sample
Q157: Provide an appropriate response.
-The following is
Unlock this Answer For Free Now!
View this answer and more for free by performing one of the following actions

Scan the QR code to install the App and get 2 free unlocks

Unlock quizzes for free by uploading documents