Solve the problem.
-The graph shows the results of an ongoing survey of 500 random students at State University from 2007 through 2012. The survey asked whether students bought the majority of their music on CD or if they downloaded the majority of their music as MP3 files from the internet. Use the graph to estimate the point of intersection. In what year was the number of students who bought the majority of their music on CDs and the number of students who downloaded the majority of their music as MP3 files the same? How many students were there for each? 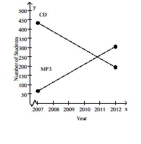
A) (2011, 250) ; 2011; 250 students
B) (2010, 300) ; 2011; 300 students
C) (2010, 250) ; 2010; 250 students
D) (2011, 200) ; 2011; 200 students
Correct Answer:
Verified
Q1: Solve the system by the substitution
Q2: Determine whether the given ordered pair
Q3: Solve the system by the substitution
Q5: Determine whether the given ordered pair
Q6: Solve the system by graphing.
-
Q7: Solve the system by the substitution
Q8: Determine whether the given ordered pair
Q9: Solve the system by graphing.
-
Q10: Solve the system by graphing.
-
Q11: Determine whether the given ordered pair
Unlock this Answer For Free Now!
View this answer and more for free by performing one of the following actions

Scan the QR code to install the App and get 2 free unlocks

Unlock quizzes for free by uploading documents