The graph below is of a normal curve. The shaded portion of the graph represents 68% of the total area under the curve. According to the graph, what is the value of the 97.5th percentile P97.5 ?
A) 2
B) 3
C) 12
D) 35
E) None of the above. 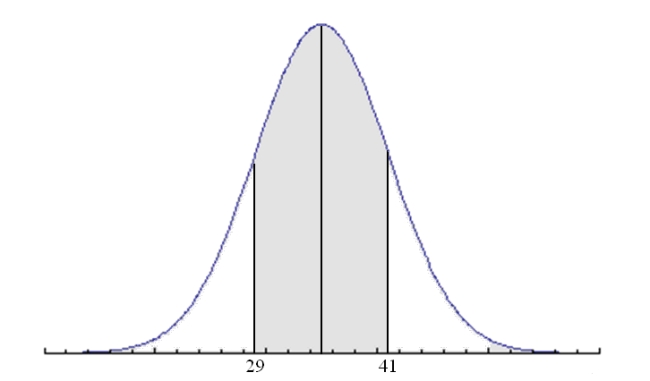
Correct Answer:
Verified
Q23: A local church lottery states that the
Q24: The height of an 18-year old student
Q25: A normal distribution has a mean of
Q26: An honest six-sided die is tossed a
Q27: The time that it takes an Olympic
Q29: The actual number of hours that a
Q30: The time that it takes a student
Q31: A local church lottery states that the
Q32: Which of the following scenarios would it
Q33: The actual number of hours that a
Unlock this Answer For Free Now!
View this answer and more for free by performing one of the following actions

Scan the QR code to install the App and get 2 free unlocks

Unlock quizzes for free by uploading documents