The box-plot shown below was constructed from data regarding the annual salaries of both Opera singers and Country Western singers. 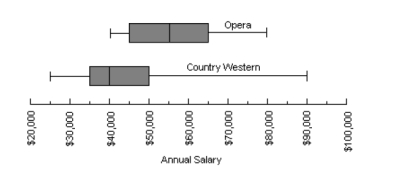 Based on the graph shown above, what is the inter-quartile range of annual salaries for Opera signers?
A) $15000
B) $20000
C) $45000
D) $66000
E) None of the above.
Correct Answer:
Verified
Q23: The pie-chart shown below gives the responses
Q24: The members of the golf club at
Q25: The data shown below represents the annual
Q26: In order to qualify for the game
Q27: In order to qualify for the game
Q29: The members of the golf club at
Q30: In order to qualify for the game
Q31: The members of the golf club at
Q32: The histogram shown below gives the annual
Q33: The members of the golf club at
Unlock this Answer For Free Now!
View this answer and more for free by performing one of the following actions

Scan the QR code to install the App and get 2 free unlocks

Unlock quizzes for free by uploading documents