The histogram shown below gives the heights of 27 recent college graduates. 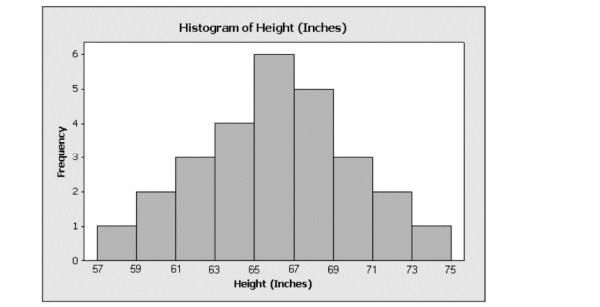
-Refer to the situation in above ; the median height is within which interval?
A) 63 inches to 65 inches
B) 65 inches to 67 inches
C) 67 inches to 69 inches
D) Can't determine from this graph.
E) None of the above.
Correct Answer:
Verified
Q16: The histogram shown below gives the final
Q17: You and several friends in your dorm
Q18: The box-plot shown below was constructed from
Q19: The box-plot shown below was constructed from
Q20: Refer to the situation in problem 7;
Q22: In order to qualify for the game
Q23: The pie-chart shown below gives the responses
Q24: The members of the golf club at
Q25: The data shown below represents the annual
Q26: In order to qualify for the game
Unlock this Answer For Free Now!
View this answer and more for free by performing one of the following actions

Scan the QR code to install the App and get 2 free unlocks

Unlock quizzes for free by uploading documents