The chart below shows the average travel time in minutes between five different cities. Give the total time (cost) of the tour found by applying the cheapest-link algorithm. 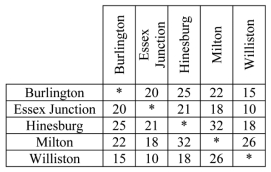
A) 81
B) 85
C) 92
D) 100
E) None of the above.
Correct Answer:
Verified
Q25: Which of the graphs below has a
Q26: Which algorithm will always give the optimal
Q27: How many edges are in the complete
Q28: Consider the graph shown below; how many
Q29: Consider the weighted graph given below; which
Q31: Consider the weighted graph given below; which
Q32: Consider the weighted graph given below; apply
Q33: How many distinct Hamilton Circuits, if any,
Q34: Consider the weighted graph given below; apply
Q35: Consider the graph shown below; how many
Unlock this Answer For Free Now!
View this answer and more for free by performing one of the following actions

Scan the QR code to install the App and get 2 free unlocks

Unlock quizzes for free by uploading documents