The diagram on the right shows data from a single earthquake plotted on a diagram that shows the mathematical relationship between distance, magnitude, and S-wave amplitude. What do these data show? 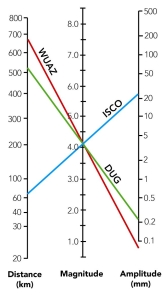
A) the distance between stations WUAZ and DUG is 680 km
B) station ISCO is 22 km from the earthquake epicenter
C) the local magnitude of the earthquake recorded by these three stations is 4.1 MI
D) station DUG was closest to the earthquake
Correct Answer:
Verified
Q55: Using this nomogram, what is the magnitude
Q56: Which of the following places did NOT
Q57: How do we determine the location of
Q58: Which of the following did NOT cause
Q59: Which of the following would NOT be
Q61: Tsunami may be generated by:
A) earthquakes that
Q62: Prehistoric earthquakes may be studied by:
A) digging
Q63: Which of the following is true about
Q64: What feature suggests that this is a
Q65: What types of information can be gained
Unlock this Answer For Free Now!
View this answer and more for free by performing one of the following actions

Scan the QR code to install the App and get 2 free unlocks

Unlock quizzes for free by uploading documents