The graph below shows the percentage of students enrolled in the College of Engineering at State University. Use
the graph to answer the question. 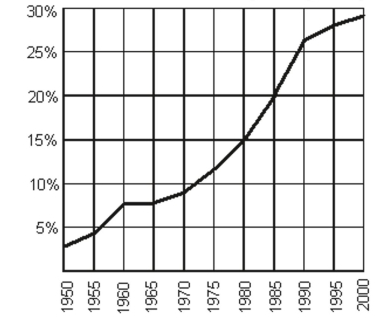
-Between what two years is the difference in function values equal to 5%?
A) between 1980 and 1985
B) between 1985 and 1990
C) between 1970 and 1975
D) between 1960 and 1965 8 Identify the Domain and Range of a Function from Its Graph
Correct Answer:
Verified
Q59: Graph Functions by Plotting Points
Graph the
Q60: Graph Functions by Plotting Points
Graph the
Q61: The graph below shows the percentage
Q62: The graph below shows the percentage
Unlock this Answer For Free Now!
View this answer and more for free by performing one of the following actions

Scan the QR code to install the App and get 2 free unlocks

Unlock quizzes for free by uploading documents