Thirty households were surveyed for the number of televisions in each home. Following are the results.
Construct a frequency histogram.
A) 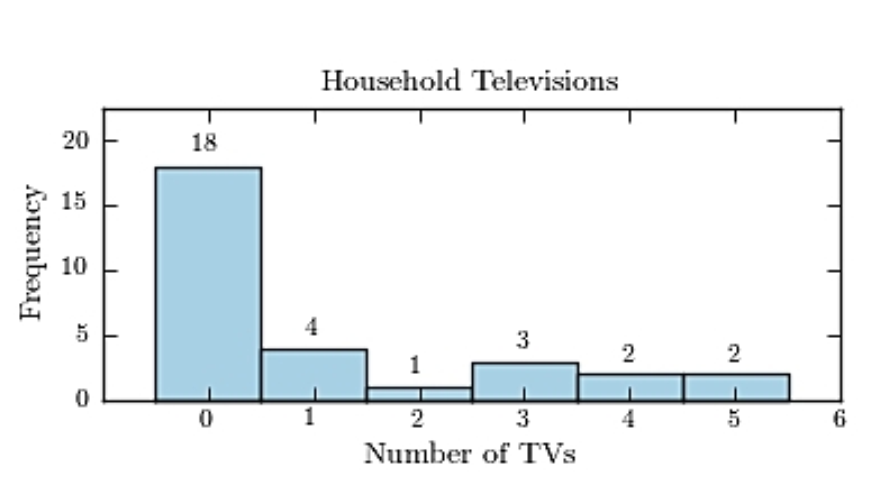
B) 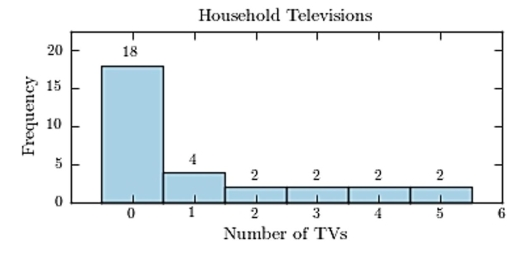
C) 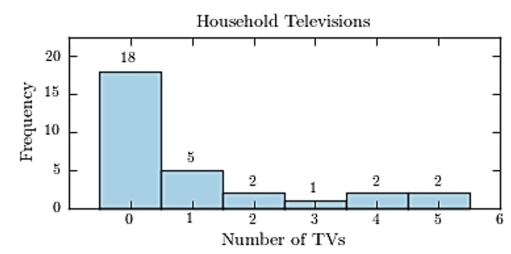
D) 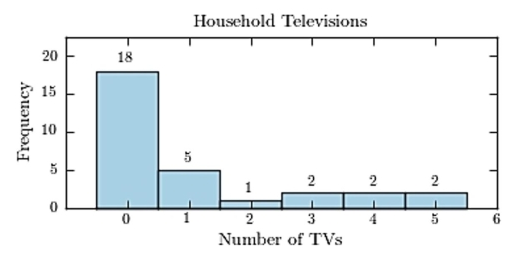
Correct Answer:
Verified
Q14: Classify the histogram as unimodal or bimodal.
Q15: The following pie chart presents the percentages
Q16: The following frequency distribution presents the
Q17: The following frequency distribution presents the
Q18: The following table presents the purchase
Q20: Following is a pie chart that presents
Q21: The amounts 5 and 2 are compared.
Q22: A sample of 200 high school
Q23: Following are the numbers of Dean's
Q24: Construct a stem-and-leaf plot for the
Unlock this Answer For Free Now!
View this answer and more for free by performing one of the following actions

Scan the QR code to install the App and get 2 free unlocks

Unlock quizzes for free by uploading documents