Solve the problem.
-At the National Criminologists Association's annual convention, participants filled out a questionnaire asking what they thought was the most important cause for criminal behavior. The tally was as follows. 
Construct a Pareto chart to display these findings.
A) 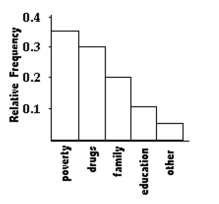
B) 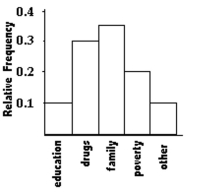
C) 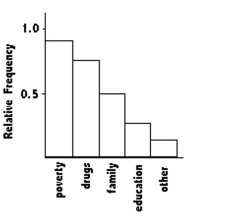
D) 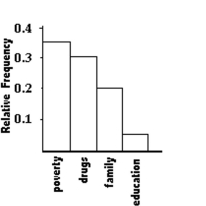
Correct Answer:
Verified
Q122: Construct a pie chart representing the given
Q123: Construct a pie chart representing the
Q124: Solve the problem.
-A car dealer is
Q125: Construct a pie chart representing the
Q126: Construct a pie chart representing the
Q127: Construct a pie chart representing the given
Q129: Construct a pie chart representing the given
Q130: Construct a pie chart representing the
Q131: Construct a pie chart representing the given
Q132: Construct a pie chart representing the given
Unlock this Answer For Free Now!
View this answer and more for free by performing one of the following actions

Scan the QR code to install the App and get 2 free unlocks

Unlock quizzes for free by uploading documents