The following scatterplot shows the percentage of the vote a candidate received in the 2004 senatorial elections according to the voter's income level based on an exit poll of voters conducted by CNN. The income levels 1-8 correspond to the
Following income classes: 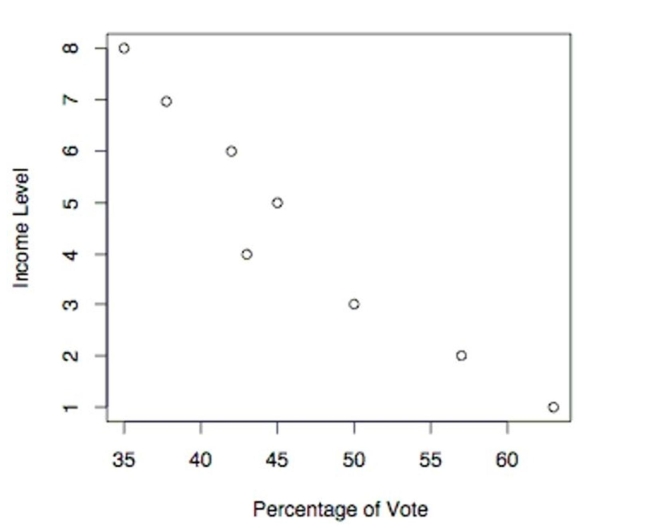 Use the election scatterplot to determine whether there is a correlation between percentage of vote and income level at
The 0.01 significance level with a null hypothesis of
A) The test statistic is not between the critical values, so we reject the null hypothesis. There is sufficient evidence to support a claim of correlation between percentage of vote and income level.
B) The test statistic is between the critical values, so we fail to reject the null hypothesis. There is no evidence to support a claim of correlation between percentage of vote and income level.
C) The test statistic is between the critical values, so we reject the null hypothesis. There is sufficient evidence to support a claim of correlation between percentage of vote and income level.
D) The test statistic is not between the critical values, so we fail to reject the null hypothesis. There is no evidence to support a claim of correlation between percentage of vote and income level.
Correct Answer:
Verified
Q42: Which statement is false about the Wilcoxon
Q43: If the critical values for a run
Q44: A rank correlation coefficient is to be
Q45: Find the critical value. Assume that
Q46: Which of the following is not an
Q48: Use the runs test to determine
Q49: Which of the following terms is sometimes
Q50: Match the nonparametric test with its related
Q51: The following scatterplot shows the percentage
Q52: Which of the following distribution-free tests has
Unlock this Answer For Free Now!
View this answer and more for free by performing one of the following actions

Scan the QR code to install the App and get 2 free unlocks

Unlock quizzes for free by uploading documents