The following boxplots show monthly sales revenue figures ($ thousands) for a
discount office supply company with locations in three different regions of the U.S.
(Northeast, Southeast, and West). 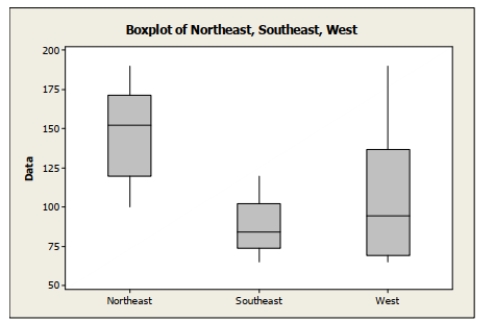
A. Which region has the highest median sales revenue?
b. Which region has the lowest median sales revenue?
c. Which region has the most variable sales revenue values? Explain.
Correct Answer:
Verified
View Answer
Unlock this answer now
Get Access to more Verified Answers free of charge
Q1: Following is the five number summary
Q2: Suppose the marketing manager who was earning
Q3: The following table shows data on
Q4: The following table shows representative recent
Q5: The following table shows representative recent
Q7: Following is a histogram of salaries (in
Q8: The following table shows representative recent
Q9: For the data on total assets ($
Q10: The following boxplots show monthly sales revenue
Q11: Below is a histogram of salaries (in
Unlock this Answer For Free Now!
View this answer and more for free by performing one of the following actions

Scan the QR code to install the App and get 2 free unlocks

Unlock quizzes for free by uploading documents