Quinn's Café serves ice cream. She asks 100 of her regular customers to take a taste test and pick
The flavour they like the best. The results are shown in the following table. 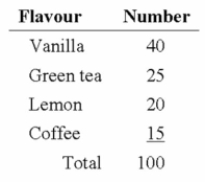
Is the data quantitative or qualitative? What is the name of the table shown?
A) quantitative, simple table
B) quantitative, frequency table
C) qualitative, frequency table
D) qualitative, cumulative frequency distribution
E) quantitative, bar chart
Correct Answer:
Verified
Q1: Using the frequency table below, determine the
Q2: (i. A frequency distribution is grouping of
Q3: When data is collected using a qualitative,
Q4: The chart below shows the Gross Domestic
Q5: Monthly commissions of first-year insurance brokers are
Q7: If the enrolment for this Faculty of
Q8: A student was interested in the cigarette
Q9: (i. A frequency table is a grouping
Q15: Which of the following would be most
Q17: (i. Bar charts are useful for showing
Unlock this Answer For Free Now!
View this answer and more for free by performing one of the following actions

Scan the QR code to install the App and get 2 free unlocks

Unlock quizzes for free by uploading documents