Given the scatter diagram below, that shows the number of workdays absent per year based on the
Age of the employees, which of the following statements are true? 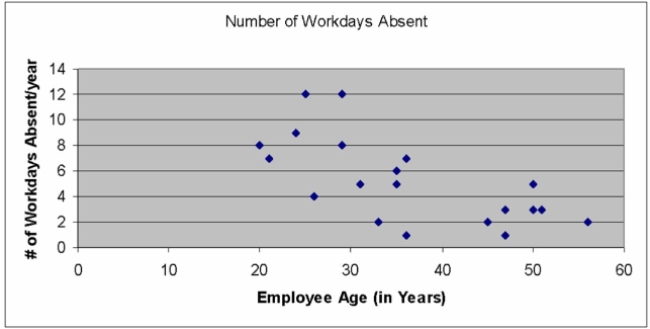
A) There is clearly no relationship whatsoever between an employee's age and the number of workday absences that they take.
B) There is a single but strong outlier in this data set.
C) There appears to be an inverse relationship between the two variables.
D) There is a single but strong outlier in this data set, but clearly no relationship whatsoever between an employee's age and the number of workday absences that they take.
E) There is a single but strong outlier in this data set and an inverse relationship between the two variables.
Correct Answer:
Verified
Q3: A scatter diagram is a chart,
A) in
Q4: Data is collected from 20 sales people
Q5: A sales manager for an advertising agency
Q6: A sales manager for an advertising agency
Q7: i. In order to visualize the form
Q9: i. The least squares technique minimizes the
Q10: i. If we are studying the relationship
Q11: i. A scatter diagram is a chart
Q13: i. The technique used to measure the
Q18: In the regression equation, Y' = a
Unlock this Answer For Free Now!
View this answer and more for free by performing one of the following actions

Scan the QR code to install the App and get 2 free unlocks

Unlock quizzes for free by uploading documents