Given the scatter diagram below, that shows the number of workdays absent per year based on the
Age of the employees, which of the following statements are true? 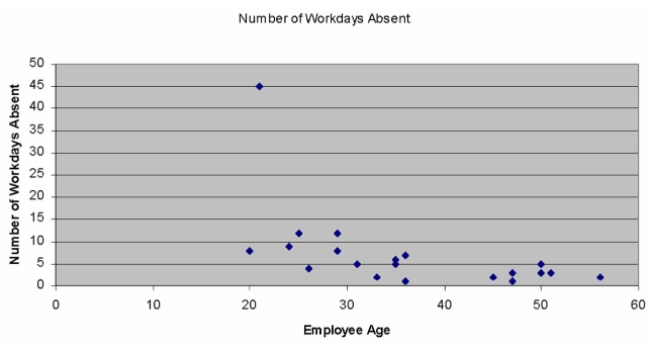
A) There is clearly no relationship whatsoever between an employee's age and the number of workday absences that they take.
B) There is a single but strong outlier in this data set.
C) In analyzing this data, you may wish to remove the one point that doesn't "fit" with all the others before continuing your analysis.
D) There is clearly no relationship whatsoever between an employee's age and the number of workday absences that they take, however, there is a single but strong outlier in this
Data set.
E) There is a single but strong outlier in this data set; in analyzing this data, you may wish to remove the one point that doesn't "fit" with all the others before continuing your analysis.
Correct Answer:
Verified
Q3: A scatter diagram is a chart,
A) in
Q9: i. The least squares technique minimizes the
Q10: i. If we are studying the relationship
Q11: i. A scatter diagram is a chart
Q11: What is the variable used to predict
Q12: Based on the regression equation, we can
A)
Q13: i. The technique used to measure the
Q15: Suppose the least squares regression equation is
Q17: i. If we are studying the relationship
Q18: In the equation Y' = a +
Unlock this Answer For Free Now!
View this answer and more for free by performing one of the following actions

Scan the QR code to install the App and get 2 free unlocks

Unlock quizzes for free by uploading documents