In the following graph, S and D represent the supply and demand curves respectively, in the labour market. Refer to the graph to answer the question. 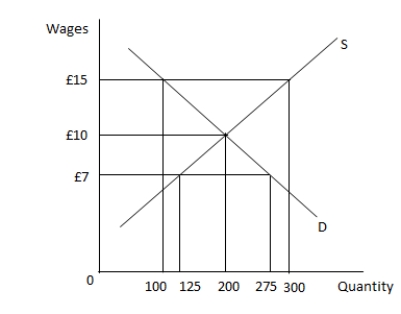 When the wage in the market is set at £7:
A) there is a surplus of 100 workers.
B) there is a shortage of 150 workers.
C) there is a surplus of 200 workers.
D) there is a shortage of 275 workers.
Correct Answer:
Verified
Q47: The balance of payments measures the:
A) difference
Q48: When would inflation targeting using interest rates
Q49: When the UK is running a balance
Q50: Which of the following statements is correct?
A)
Q51: If a union negotiates a wage above
Q53: Which of the following is an instrument
Q54: Which of the following is true for
Q55: Suppose the demand for construction jobs declines
Q56: The unemployment that resulted when the typewriter
Q57: In the following graph, S and D
Unlock this Answer For Free Now!
View this answer and more for free by performing one of the following actions

Scan the QR code to install the App and get 2 free unlocks

Unlock quizzes for free by uploading documents