Short Answer
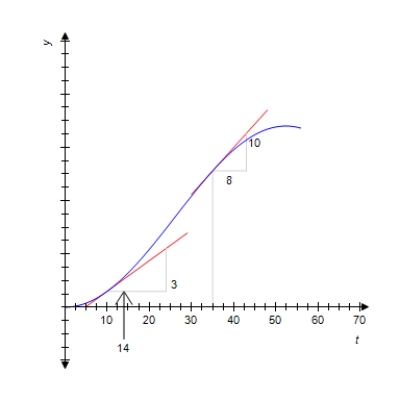
The graph shows the volume of wood produced in a single-species forest. Here f(t) is measured in cubic meters/hectare and t is measured in years. By computing the slopes of the respective tangent lines, estimate the rate at which the wood grown is changing at the beginning of year 10 and at the beginning of year 35.
Correct Answer:
Verified
Related Questions
Q27: Find the indicated one-sided limit.
Q28: Let Q29: Use the four-step process to find the Q30: Use the four-step process to find the Q31: In the following figure, f(t) gives the Unlock this Answer For Free Now! View this answer and more for free by performing one of the following actions Scan the QR code to install the App and get 2 free unlocks Unlock quizzes for free by uploading documents![]()

