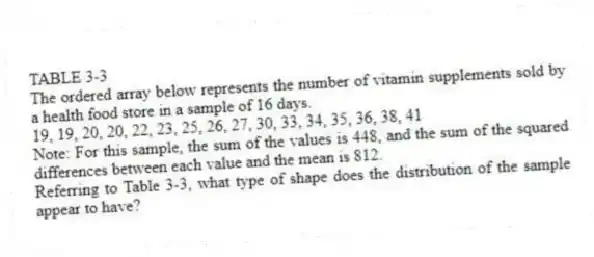
TABLE 3-3
The ordered array below represents the number of vitamin supplements sold by a health food store in a sample of 16 days.
19, 19, 20, 20, 22, 23, 25, 26, 27, 30, 33, 34, 35, 36, 38, 41
Note: For this sample, the sum of the values is 448, and the sum of the squared differences between each value and the mean is 812.
-Referring to Table 3-3, what type of shape does the distribution of the sample appear to have?
Correct Answer:
Verified
View Answer
Unlock this answer now
Get Access to more Verified Answers free of charge
Q46: If the arithmetic mean of a numerical
Q77: TABLE 3-2
The data below represent the amount
Q78: TABLE 3-3
The ordered array below represents the
Q79: TABLE 3-2
The data below represent the amount
Q80: TABLE 3-2
The data below represent the amount
Q82: TABLE 3-3
The ordered array below represents the
Q83: TABLE 3-4
The ordered array below represents the
Q84: TABLE 3-4
The ordered array below represents the
Q85: TABLE 3-4
The ordered array below represents the
Q86: TABLE 3-3
The ordered array below represents the
Unlock this Answer For Free Now!
View this answer and more for free by performing one of the following actions

Scan the QR code to install the App and get 2 free unlocks

Unlock quizzes for free by uploading documents