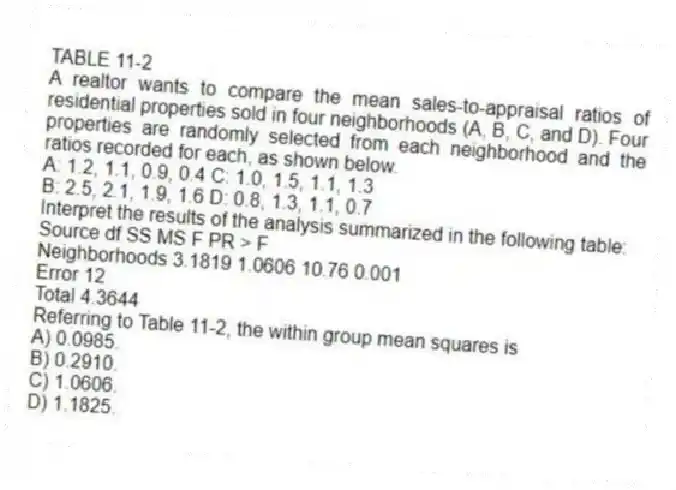
TABLE 11-2
A realtor wants to compare the mean sales-to-appraisal ratios of residential properties sold in four neighborhoods (A, B, C, and D) . Four properties are randomly selected from each neighborhood and the ratios recorded for each, as shown below.
A: 1.2, 1.1, 0.9, 0.4 C: 1.0, 1.5, 1.1, 1.3
B: 2.5, 2.1, 1.9, 1.6 D: 0.8, 1.3, 1.1, 0.7
Interpret the results of the analysis summarized in the following table:
Source df SS MS F PR > F
Neighborhoods 3.1819 1.0606 10.76 0.001
Error 12
Total 4.3644
-Referring to Table 11-2, the within group mean squares is
A) 0.0985.
B) 0.2910.
C) 1.0606.
D) 1.1825.
Correct Answer:
Verified
Q2: In a one-way ANOVA,the null hypothesis is
Q11: A completely randomized design
A)has only one factor
Q12: When would you use the Tukey-Kramer procedure?
A)To
Q19: TABLE 11-1
An airline wants to select a
Q20: The degrees of freedom for the F
Q22: TABLE 11-2
A realtor wants to compare the
Q23: TABLE 11-3
As part of an evaluation program,
Q24: TABLE 11-2
A realtor wants to compare the
Q25: TABLE 11-3
As part of an evaluation program,
Q26: TABLE 11-2
A realtor wants to compare the
Unlock this Answer For Free Now!
View this answer and more for free by performing one of the following actions

Scan the QR code to install the App and get 2 free unlocks

Unlock quizzes for free by uploading documents