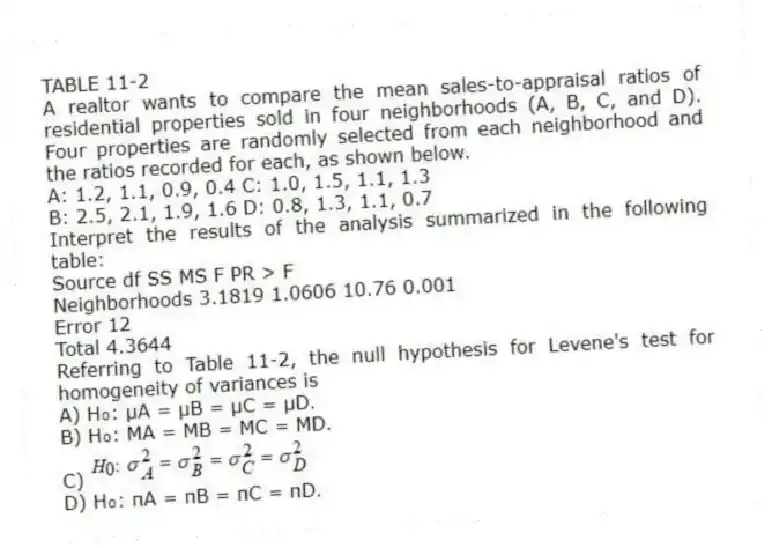
TABLE 11-2
A realtor wants to compare the mean sales-to-appraisal ratios of residential properties sold in four neighborhoods (A, B, C, and D) . Four properties are randomly selected from each neighborhood and the ratios recorded for each, as shown below.
A: 1.2, 1.1, 0.9, 0.4 C: 1.0, 1.5, 1.1, 1.3
B: 2.5, 2.1, 1.9, 1.6 D: 0.8, 1.3, 1.1, 0.7
Interpret the results of the analysis summarized in the following table:
Source df SS MS F PR > F
Neighborhoods 3.1819 1.0606 10.76 0.001
Error 12
Total 4.3644
-Referring to Table 11-2, the null hypothesis for Levene's test for homogeneity of variances is
A) H₀: μA = μB = μC = μD.
B) H₀: MA = MB = MC = MD.
C) 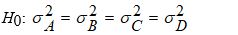
D) H₀: πA = πB = πC = πD.
Correct Answer:
Verified
Q27: TABLE 11-3
As part of an evaluation program,
Q28: TABLE 11-2
A realtor wants to compare the
Q29: TABLE 11-3
As part of an evaluation program,
Q30: TABLE 11-3
As part of an evaluation program,
Q31: TABLE 11-2
A realtor wants to compare the
Q33: TABLE 11-2
A realtor wants to compare the
Q34: TABLE 11-3
As part of an evaluation program,
Q35: TABLE 11-2
A realtor wants to compare the
Q36: TABLE 11-3
As part of an evaluation program,
Q37: TABLE 11-3
As part of an evaluation program,
Unlock this Answer For Free Now!
View this answer and more for free by performing one of the following actions

Scan the QR code to install the App and get 2 free unlocks

Unlock quizzes for free by uploading documents