(Figure: Interpreting PFF Shifts 4) The graph depicts the effects of an improvement in technology. One can conclude from the graph that the technology 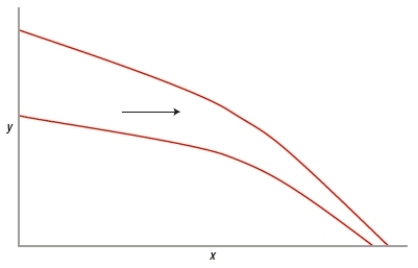
A) provided minimal benefit to this society.
B) affected the production of x more than the production of y.
C) reduced unemployment.
D) affected the production of y more than the production of x.
Correct Answer:
Verified
Q267: All output combinations on the production possibilities
Q268: Can a country have a comparative advantage
Q269: The idea that resources are specialized is
Q270: Economists include mineral deposits, oil, natural gas,
Q271: Economists refer to rent as a payment
Q273: Immigration, both legal and illegal, is a
Q274: What is NOT an economic factor of
Q275: Economists refer to the payment toward land
Q276: (Figure: Tanks and Health Care) Which point
Q277: Which scenario will lead to increased economic
Unlock this Answer For Free Now!
View this answer and more for free by performing one of the following actions

Scan the QR code to install the App and get 2 free unlocks

Unlock quizzes for free by uploading documents