The following figure shows the impact of technological change on the marginal cost of producing a certain good. With MC1 the total cost of producing Q* units is equal to _______.
A) areas a + b + c
B) areas b + c
C) area b
D) area c 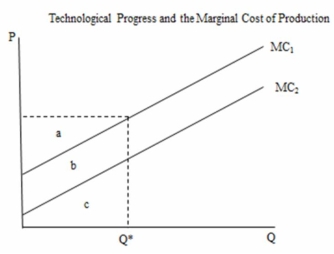
Correct Answer:
Verified
Q12: Opportunity cost _.
A) is represented by the
Q13: In the following figure, the total willingness
Q14: Aggregate demand curves are _.
A) not of
Q15: The marginal cost curve is affected by
Q16: In the following figure the marginal cost
Q18: All of the following are difficulties with
Q19: In the following figure the total cost
Q20: The benefit a consumer acquires from consuming
Q21: The equimarginal principle addresses
A) equality
B) efficiency
C) willingness
Q22: Refer to Table 3.1. According to the
Unlock this Answer For Free Now!
View this answer and more for free by performing one of the following actions

Scan the QR code to install the App and get 2 free unlocks

Unlock quizzes for free by uploading documents