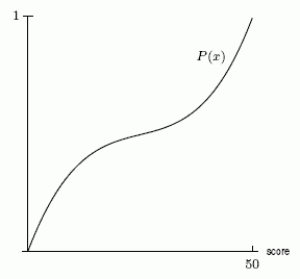
An aptitude test is given to a group of students. Scores can range from 0 to 50. Does the cumulative distribution function in the second graph correspond to the density function in the first graph? Answer "yes" or "no" 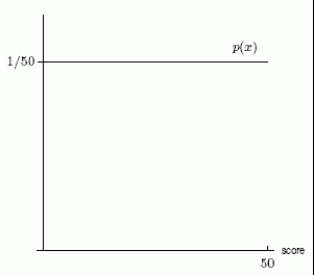
Correct Answer:
Verified
Q3: The distribution of heights, x, in meters,
Q4: The following figure gives the density function
Q5: Which of the following could possibly be
Q6: The following figure gives the density function
Q7: Suppose that the distribution of people's ages
Q9: A professor far away from here gives
Q10: The following figure gives the density function
Unlock this Answer For Free Now!
View this answer and more for free by performing one of the following actions

Scan the QR code to install the App and get 2 free unlocks

Unlock quizzes for free by uploading documents