Short Answer
Which of the following cumulative distribution graphs would most likely represent the total annual sales of milk?
I. 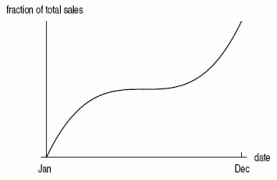 II.
II. 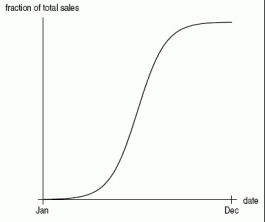 III.
III. 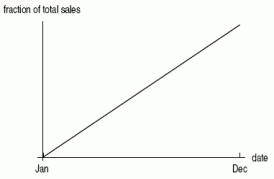
Correct Answer:
Verified
Related Questions
Q32: The probability of waiting no more than
Q33: Which of the following could possibly be
Q34: Let p(t) be a probability density
Q35: The heights, in inches, of flowers in
Unlock this Answer For Free Now!
View this answer and more for free by performing one of the following actions

Scan the QR code to install the App and get 2 free unlocks

Unlock quizzes for free by uploading documents