Short Answer
The following figure shows a density function and the corresponding distribution function. Which curve represents the cumulative distribution function? 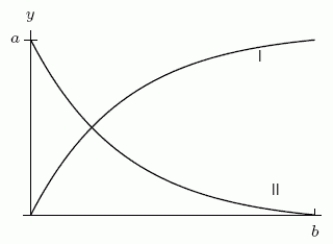
Correct Answer:
Verified
Related Questions
Q19: The following figure gives the density function
Q20: The density function f(x) shown below describes
Q21: The probability of waiting no more than
Q22: The probability of waiting no more than
Q23: A banana plant typically has about 40
Q25: The density function for the height of
Q26: The graph of a probability density function
Unlock this Answer For Free Now!
View this answer and more for free by performing one of the following actions

Scan the QR code to install the App and get 2 free unlocks

Unlock quizzes for free by uploading documents