The following figure shows the distribution of the number of hours of television viewed per day by a group of children. Estimate the percent of the children who watched less than 3 hours per day. 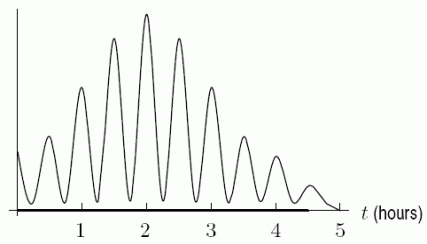
A) 65%
B) 95%
C) 50%
D) 80%
Correct Answer:
Verified
Q45: The density function for the shelf life,
Q46: In the following probability density function, is
Q47: Suppose scores from a standardized test measure
Q48: Which of the following functions makes the
Q49: According to data from 2007, the height
Q51: A banana plant typically has about 40
Q52: The final exam scores for a calculus
Q53: The annual rainfall for a desert city
Q54: The lifespan of a bug is approximately
Q55: Each of the following density functions represents
Unlock this Answer For Free Now!
View this answer and more for free by performing one of the following actions

Scan the QR code to install the App and get 2 free unlocks

Unlock quizzes for free by uploading documents